How much is going into our water?
This section is designed to give you some statistics on the use of storm overflows. The information is mostly based on data provided by South West Water but where this is an estimate we have made this clear.
SWW region
2024 (Data expected 31 March 2025)
2023 58,249 spills for a total duration of 530,737 hours
2022 37,649 spills for a total duration of 290,271 hours (with the driest summer on record)
2021 42,484 spills for a total duration of 351,785 hours
In January 2023 SWW claimed to have reduced spills by 50% and duration by 75% between 2021 and 2022 with the majority of this due to it's interventions.
Exmouth
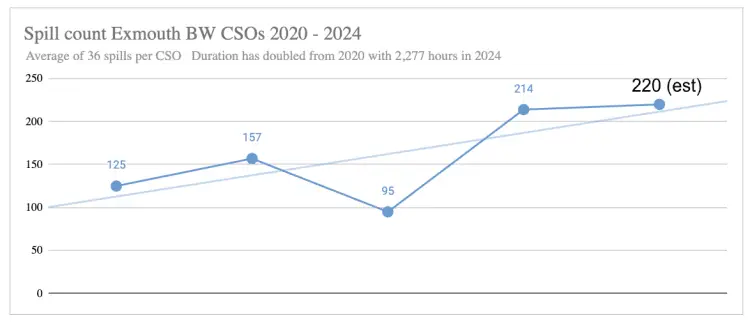
The chart below shows the number of spills and duration for the four overflows that affect water quality in Exmouth. It also shows the totals for the treatment works at Maer Lane which discharges to Sandy Bay. The number of spills in 2024 is an estimate by ESCAPE. With the exception of 2022 duration has increased since 2019 and has doubled between 2020 and 2024.
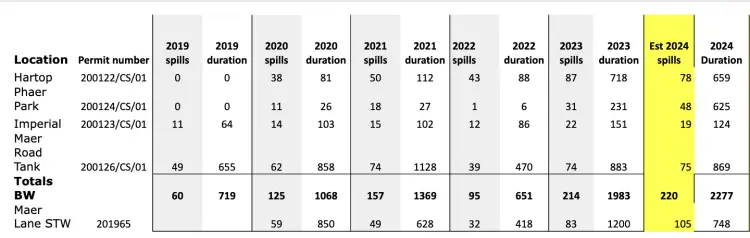
SWW's target is fewer than 20 spills a year by the end of 2025. The graph below shows the actual number of spills over time has increased and the average over five years is 36 spills a year.
ESCAPE's view
The data over the last few years shows an increase in spills and duration. SWW has plans to increase the amount of sewage passed to the treatment works in 2025 and by 2028 to increase the amount of sewage treated. ESCAPE does not agree that moving the sewage to another location is acceptable and believes the reductions will not be achieved. We are calling for an independent expert assesment of the Exmouth infrastructure and plans.
Article published Wednesday 19th February 2025